There are many games these days which require the players to thoroughly explore vast virtual worlds which may take more time than some are willing or able to invest. Or there are hidden features on a map to which players may want to return at some point, without having to skim through the map over and over again. Given that it is very common to find dedicated fans of the game which take the time to not only do the exploration but also note down their findings in annotated maps. This blog post is about bringing such an ingame map to a user-friendly web page.
The problem
The problem, or challenge, whose solution I want to present in this blog post is the following: For multiple ingame-locations there exists a map each. The map is a large PNG image with each side being multiple thousand pixels in width. I want to embed each map dynamically into an ASP.NET Core Razor Page. Initially the image should be displayed as resized to fit a container of a fixed width of 1000px and variable height according to the image's aspect ratio. The user should be able to interact with the image by zooming into it and, when zoomed in, moving the visible part of the map by dragging it with the mouse.
The plan
To achieve a fully working example, the following software components should be realized:
- New page where the user can upload an image and specify the name of the location it belongs to.
- Generate map tiles from the image. This includes determining the zoom levels of the image, resizing it to each zoom level and then slicing it up into square pieces.
Save the map tiles to the file system and the location name and image properties to a database. - New page for each location, displaying the location's map.
The first step is a pretty basic ASP.NET Core use case and won't be explained in further detail. All it includes is a combination of GET and POST actions to display the form and submit it. The image can be uploaded using the HTML element <input type="file" accept="image/png" /> which then gets saved as IFormFile into the respective ViewModel. That IFormFile will then be the input for the second step.
For the second step the library Magick.NET will be used. It offers a large amount of tools to flexibly edit images. Cf. https://github.com/dlemstra/Magick.NET.
For the third step, displaying the map, the JavaScript library Leaflet is used, which is a widely used library for displaying maps and comes with specific support for non-geographical maps. Cf. https://leafletjs.com/index.html.
Generating image tiles
While Leaflet offers the possibility to use unedited full-size images as base for the map, something more sophisticated is sought after here. The problem with the easy solution of just putting the unedited image is, that it has a proud size of around 20MB, each. And as the entire image should be displayed initially that may lead to pretty long loading times. Thus the image shall be available in different sizes for each zoom level. And in order to not having to load the entire image when the user zooms in but only the visible extract, it is necessary to split the image into tiles.
There's some standalone tools available with which this process can be done easily. But none of them did exactly what I had in mind, and a tool which needs to be operated manually is anyway suboptimal, as the image processing should start automatically after it has been uploaded. Thus the decision was made to write an own piece of software which splits the image up to my specific needs. This is done with the .NET port of ImageMagick - Magick.NET, which is available as Nuget package.
Determining zoom levels and scales
The maps I expect as input may vary largely in size, some may well be up to 10'000 by 10'000 px in size, others may be small enough so that zooming isn't even a thing to consider. Thus the first step of image processing is determining how many zoom levels the map should have, and what the scales of each level are. There are different feasible strategies to this and I experimented with a few different ones, but here's the one I went with.
The source code for what is being described here can be found here: https://github.com/Finrod-Amandil/PokeOneWeb/blob/4df3aac7fd0645dd8b45bb9aa80af06ef79a2c3b/PokeOneWeb/Services/ImageTiler/Impl/ImageTilerService.cs
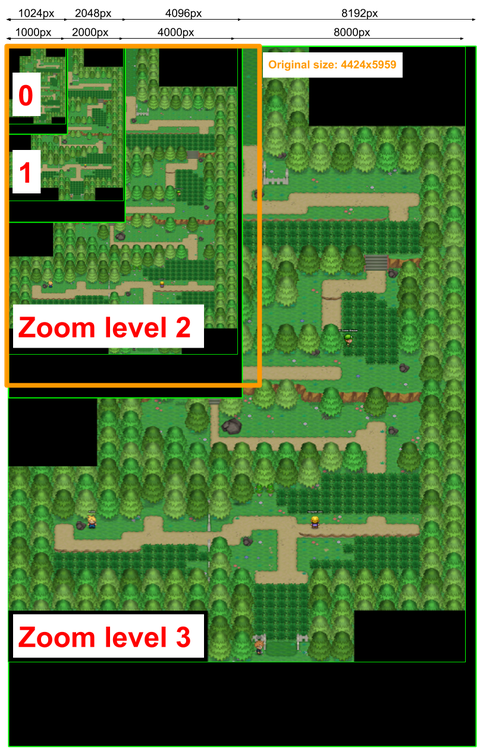
For a first prototype the plan is to have a container on the web page which is 1000px wide. When the page is loaded, the map should be zoomed all the way out. At that zoom level (zoom level 0) the map should be exactly as wide as the container. The height of the container changes depending on the aspect ratio of the image. Every zoom level from there should display the image at a size which is twice as big as the previous one. The user should be able to zoom as far as to the first zoom level where the image is displayed at over 100% of its original size.
The test image I am working with has a size of 4424px * 5959px. This means that for this image the following zoom levels and respective sizes are available:
- zoom level 0: 1000px * 1346px
- zoom level 1: 2000px * 2693px
- zoom level 2: 4000px * 5387px
- zoom level 3: 8000px * 10775px
The tiles should always have a size of 256px * 256px (default size used by Leaflet). Obviously the image sizes we got are not divisible by 256 which would result in cropped off tiles, which would then be stretched by leaflet which would look very ugly which is not good. Thus it is required to extend the image for each zoom level to a size which is divisible by the tile size. Thus as base size for zoom level 0 a width of 1024px and a height of 1536px is used instead. The extension is scaled so that the ratio between the total image sizes remains 2 between each zoom level. This results in the following total image sizes with extension:
- zoom level 0: 1024px * 1536px
- zoom level 1: 2048px * 3072px
- zoom level 2: 4096px * 6144px
- zoom level 3: 8192px * 12288px
Creating and saving the tiles
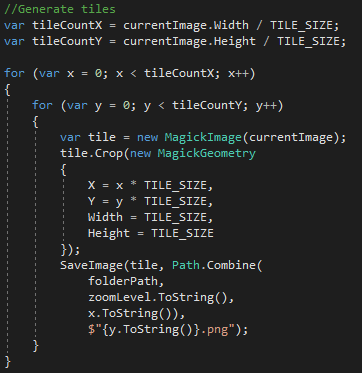
To create the tiles a nested for-Loop is used which iterates over the x and y indices of the tiles to be generated. Each tile is then extracted from the resized image using Magick.NET's "Crop"-Method.
For saving the tile, a new folder is created for each zoom level, in which there's one folder for each x-index of the available tiles. The name of the tile is simply the y-index, so that a tile's URL will end in "/z/x/y.png" with z being the zoom level.
Displaying the map
The complete source code of this file can be found here: https://github.com/Finrod-Amandil/PokeOneWeb/blob/4df3aac7fd0645dd8b45bb9aa80af06ef79a2c3b/PokeOneWeb/Views/Location/Detail.cshtml
Now, with all preparations done all there's left to do is explaining Leaflet how it should display the map. The image properties, which are the original width and height and the maximum zoom level, are passed to the view through a ViewModel.
The only explicit HTML element is a div with its ID set to "map", all the rest is JavaScript.
The div is dynamically resized to 1000px width and as high so that the image just fits in at 1000px width. Note that the black extension that was added in order to make the image dimensions divisible by 256px will overlap the container size and will not be visible.
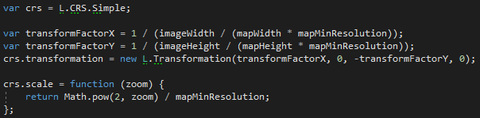
Every Leaflet map has a coordinate system. As Leaflet is mainly used for real world maps, that coordinate system is one using latitude and longitude, a concept which isn't really a thing for most game maps. Instead we use CRS.Simple which is an orthonormal coordinate system with X and Y. The important thing here is, that the origin of the coordinate system is in the bottom left corner of the image. This means that the Y coordinate is inverted compared to the common coordinate system used to refer to positions on a screen, where the origin is in the top left corner. As easiest solution the coordinate system is transformed so that the origin is shifted to the top left corner and accepting that all Y coordinates in the image are negative.
The target shall be to get a coordinate system where, barring the sign of the Y coordinate, a position on the map correlates to the pixel-position in the original, unresized image. By default the area of the map is mapped to the coordinate ranges [0 .. 8000] for X (corresponds to the image size of the highest zoom level). Thus this needs to be transformed to [0 .. 4424] (similarily for the Y coordinate)
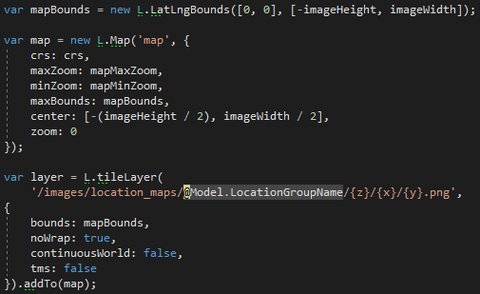
With that, the map can be created. The important properties of the map include:
- Using the newly generated coordinate system.
- Minimum and maximum zoom (minimum is always 0, maximum depends on the image size)
- The bounds of the map which avoids that the user can pan out of the image.
- The initial zoom level and map position.
The result